How to Read Crypto Charts: Technical Analysis Guide for Beginners (2025)
Ever felt like you're staring at a foreign language when looking at crypto charts? All those lines, candlesticks, and indicators can seem incredibly daunting, leaving you wondering if you need a Ph D in finance to even begin to understand what's going on.
The frustration of watching potential opportunities slip through your fingers because you can't decipher the market's signals is a common experience. It's easy to feel overwhelmed by the sheer volume of information and the fear of making costly mistakes. Without a solid understanding of technical analysis, navigating the crypto market can feel like gambling, rather than informed investing.
This guide is designed to empower you with the knowledge and skills to confidently read crypto charts and make informed trading decisions. We'll break down the complex world of technical analysis into easy-to-understand concepts, equipping you with the tools to identify trends, predict potential price movements, and ultimately, improve your trading performance.
In this comprehensive guide, we'll explore the basics of chart types, candlestick patterns, key technical indicators (like moving averages and RSI), and essential chart patterns. You'll learn how to use these tools to identify support and resistance levels, recognize trends, and make more informed decisions about buying and selling cryptocurrencies. By mastering these techniques, you'll gain a significant edge in the dynamic and often volatile world of crypto trading. Keywords: crypto charts, technical analysis, candlestick patterns, trading indicators, support and resistance, crypto trading, trend analysis.
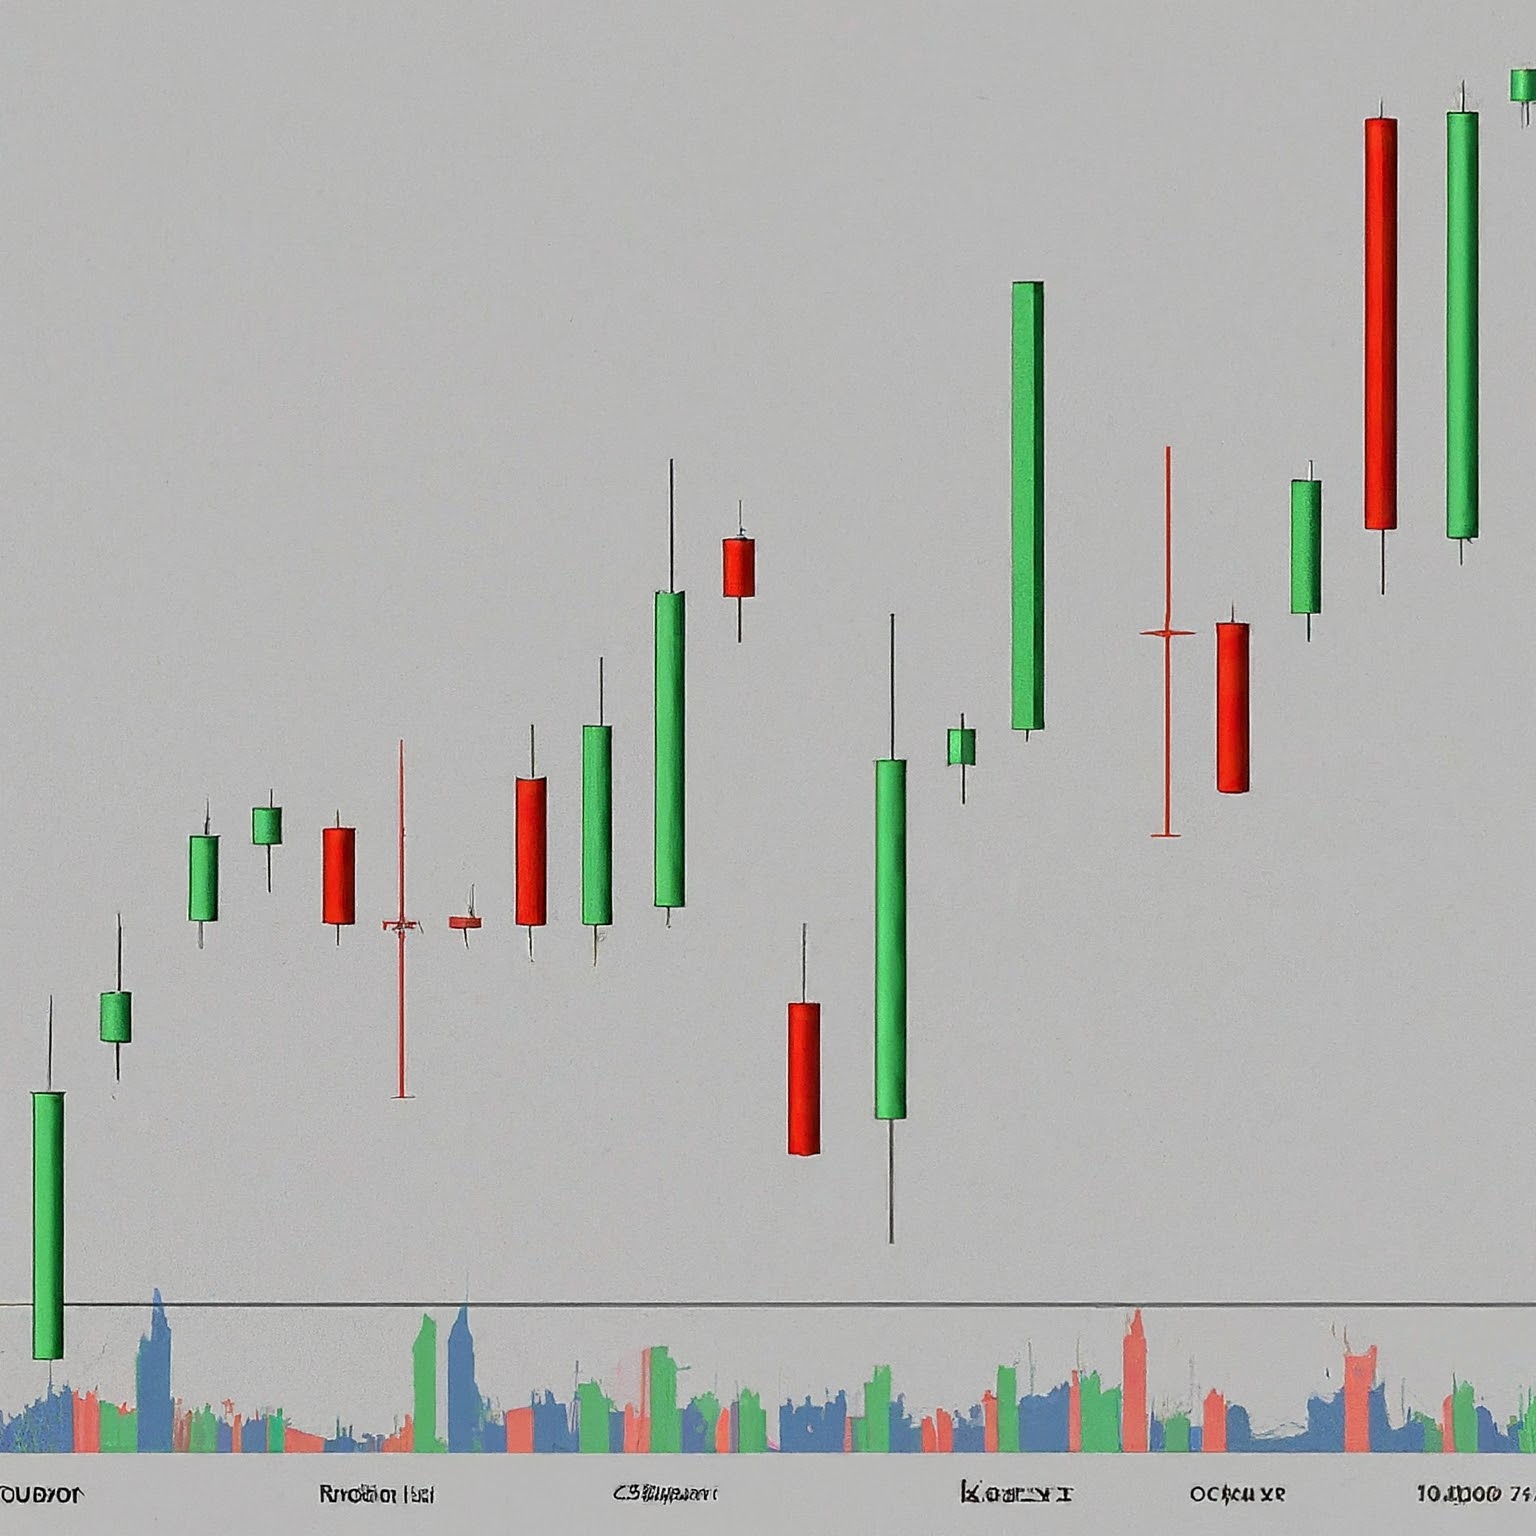
Understanding Candlestick Charts
Candlestick charts are the foundation of technical analysis, and mastering them is crucial for any beginner. I remember when I first started, I was completely lost in a sea of green and red rectangles! I'd spend hours trying to figure out what they meant, often with little success. It wasn't until I found a mentor who patiently explained the anatomy of a candlestick that things started to click. Each candlestick represents a specific time period (e.g., one day, one hour, or even one minute) and provides valuable information about the price movement during that period. The body of the candlestick shows the opening and closing prices. If the closing price is higher than the opening price, the body is typically green (or white), indicating a bullish (upward) movement. Conversely, if the closing price is lower than the opening price, the body is red (or black), indicating a bearish (downward) movement. The "wicks" or "shadows" extending above and below the body represent the highest and lowest prices reached during that period. By analyzing candlestick patterns, traders can gain insights into market sentiment and potential future price movements. For example, a "doji" candlestick, characterized by a small body and long wicks, often signals indecision in the market and a potential reversal of the current trend. Learning to identify these patterns can significantly improve your ability to predict price movements and make more profitable trades. Technical analysis empowers informed decisions in the crypto market.
Essential Technical Indicators
Technical indicators are mathematical calculations based on historical price and volume data, designed to forecast future price movements. They act as a compass, helping you navigate the complexities of the market by providing insights into trend strength, momentum, and volatility. Think of them as tools in your trading toolbox, each serving a specific purpose. Moving averages, for instance, smooth out price data over a specified period, making it easier to identify the underlying trend. A simple moving average (SMA) calculates the average price over a set number of periods, while an exponential moving average (EMA) gives more weight to recent prices, making it more responsive to changes in the market. The Relative Strength Index (RSI) is a momentum oscillator that measures the speed and change of price movements. It ranges from 0 to 100 and is typically used to identify overbought (above 70) and oversold (below 30) conditions, which can signal potential trend reversals. Another popular indicator is the Moving Average Convergence Divergence (MACD), which shows the relationship between two moving averages. The MACD line and signal line can be used to identify potential buy and sell signals. Mastering these indicators is critical to reading crypto charts. By combining different indicators and using them in conjunction with candlestick patterns and chart patterns, you can develop a more comprehensive understanding of the market and improve your trading accuracy. Be aware that no indicator is foolproof, and it's always crucial to use multiple indicators to confirm your trading signals.
Chart Patterns: Recognizing Trends
The story of chart patterns goes back to the early days of market analysis, when traders would meticulously plot price movements on paper charts. They began to notice recurring patterns that seemed to predict future price movements, laying the foundation for what we now know as chart pattern analysis. While the tools have evolved from hand-drawn charts to sophisticated software, the underlying principles remain the same. One myth surrounding chart patterns is that they are always accurate and can guarantee profits. In reality, chart patterns are simply probabilities, and they should be used in conjunction with other forms of technical analysis to increase the likelihood of success. Some of the most common chart patterns include head and shoulders, double tops and bottoms, triangles, and flags. The head and shoulders pattern, for example, is a bearish reversal pattern that signals the potential end of an uptrend. It consists of three peaks, with the middle peak (the "head") being the highest and the two outer peaks (the "shoulders") being roughly equal in height. The neckline connects the lows between the peaks, and a break below the neckline confirms the pattern and suggests a potential downward price movement. Similarly, double tops and bottoms are reversal patterns that indicate the potential end of an uptrend or downtrend, respectively. Triangles are continuation patterns that signal a period of consolidation before the price continues in the direction of the prevailing trend. By learning to recognize these patterns, you can gain a significant advantage in the market and make more informed trading decisions. Remember that practice is key, so spend time studying charts and identifying patterns to develop your pattern recognition skills.
The Hidden Secrets of Volume Analysis
Volume analysis is often overlooked by beginner traders, but it can be a powerful tool for confirming price movements and identifying potential trading opportunities. Volume represents the number of shares or contracts traded during a specific period, and it provides valuable insights into the strength and conviction behind a price trend. One hidden secret of volume analysis is that it can help you identify "fakeouts," where the price temporarily breaks through a support or resistance level but quickly reverses direction. If a breakout is accompanied by low volume, it suggests that the move is not supported by strong buying or selling pressure and is more likely to fail. Conversely, a breakout accompanied by high volume indicates strong conviction and a higher probability of success. Another secret is that volume can often precede price. For example, a significant increase in volume during a period of consolidation may signal an impending breakout. By paying attention to volume, you can anticipate price movements and position yourself to take advantage of them. Volume analysis can also be used to confirm candlestick patterns and chart patterns. For example, a bullish engulfing pattern (where a large green candlestick engulfs the previous red candlestick) is more reliable if it is accompanied by high volume. Similarly, a head and shoulders pattern is more likely to be successful if the volume is high on the left shoulder and head, and low on the right shoulder. By incorporating volume analysis into your trading strategy, you can gain a deeper understanding of market dynamics and improve your trading accuracy.
Recommended Resources for Continuous Learning
The world of technical analysis is constantly evolving, so it's crucial to commit to continuous learning and stay up-to-date with the latest trends and techniques. There are many excellent resources available online and offline that can help you expand your knowledge and refine your skills. One highly recommended resource is Investopedia, which offers a comprehensive glossary of technical analysis terms and concepts, as well as articles and tutorials on various trading strategies. Another valuable resource is Trading View, a popular charting platform that allows you to analyze price data, apply technical indicators, and share your ideas with other traders. Trading View also has a vibrant community of traders who share their insights and analysis on various cryptocurrencies. For those who prefer books, "Technical Analysis of the Financial Markets" by John Murphy is considered a classic and provides a comprehensive overview of technical analysis principles and techniques. "Candlestick Charting Explained" by Gregory Morris is an excellent resource for learning about candlestick patterns and their applications. In addition to these resources, consider following reputable traders and analysts on social media to stay informed about market trends and trading strategies. However, be sure to do your own research and critically evaluate the information you receive before making any trading decisions. Finally, remember that the best way to learn technical analysis is through practice. Spend time studying charts, applying technical indicators, and backtesting your trading strategies to develop your skills and build your confidence. There are a number of platforms out there and finding the right combination for you to master reading crypto charts can change everything.
Combining Indicators for Enhanced Accuracy
No single indicator is perfect, and relying on just one can lead to false signals and poor trading decisions. The key to successful technical analysis is to combine multiple indicators and use them in conjunction with other forms of analysis, such as candlestick patterns and chart patterns. By combining indicators, you can filter out false signals and increase the accuracy of your trading decisions. For example, you might combine a moving average with the RSI to identify potential trend reversals. If the price is trading above the moving average (indicating an uptrend) and the RSI is overbought (indicating that the price is overextended), it could signal a potential pullback or reversal. Similarly, you might combine the MACD with volume analysis to confirm a breakout. If the MACD line crosses above the signal line (indicating bullish momentum) and the breakout is accompanied by high volume, it increases the likelihood that the breakout will be successful. Another popular combination is to use Fibonacci retracement levels with support and resistance levels. Fibonacci retracement levels are horizontal lines that indicate potential levels of support and resistance based on the Fibonacci sequence. By identifying confluence between Fibonacci levels and traditional support and resistance levels, you can increase the probability of finding high-probability trading setups. The goal is to find indicators that complement each other and provide confirming signals. Experiment with different combinations and backtest your strategies to find what works best for your trading style and risk tolerance.
Tips for Avoiding Common Beginner Mistakes
One of the most common mistakes beginners make is overtrading, or trading too frequently. The constant pressure to make profits can lead to impulsive decisions and poor risk management. It's important to remember that patience is a virtue in trading, and waiting for high-probability setups is often more profitable than chasing every opportunity. Another common mistake is neglecting risk management. Always use stop-loss orders to limit your potential losses and never risk more than you can afford to lose. It's also important to diversify your portfolio and avoid putting all your eggs in one basket. Chasing pumps and dumps is another common pitfall. These are sudden and dramatic price increases or decreases driven by hype and speculation. While they can be tempting, they are often short-lived and can lead to significant losses if you get caught on the wrong side of the trade. Instead, focus on identifying fundamentally sound projects with long-term growth potential. Emotional trading is also a major problem for beginners. Fear and greed can cloud your judgment and lead to irrational decisions. It's important to develop a trading plan and stick to it, regardless of your emotions. Finally, don't be afraid to admit when you're wrong and cut your losses. Holding on to losing trades in the hope that they will eventually turn around is a recipe for disaster. By avoiding these common mistakes, you can significantly increase your chances of success in the crypto market.
Psychology of Trading: Mastering Your Emotions
The psychology of trading is a critical aspect of technical analysis that is often overlooked by beginners. Your emotions can have a significant impact on your trading decisions, and mastering your emotions is essential for long-term success. Fear and greed are two of the most powerful emotions that can affect traders. Fear can lead you to exit trades prematurely, missing out on potential profits. Greed can lead you to hold on to winning trades for too long, only to see them turn into losses. One of the best ways to manage your emotions is to develop a trading plan and stick to it. Your trading plan should outline your trading goals, risk tolerance, and trading strategies. By having a clear plan in place, you can avoid making impulsive decisions based on your emotions. Another important technique is to practice mindfulness and self-awareness. Pay attention to your thoughts and feelings as you trade and recognize when your emotions are starting to influence your decisions. If you find yourself becoming overly emotional, take a break from trading and do something that helps you relax and clear your head. It's also important to accept that losses are a part of trading. No matter how skilled you are, you will inevitably have losing trades. The key is to learn from your mistakes and not let them discourage you. Finally, surround yourself with a supportive community of traders who can offer encouragement and advice. Sharing your experiences with others can help you manage your emotions and stay on track towards your trading goals. Success with reading crypto charts requires emotional intelligence to be successful.
Fun Facts About Technical Analysis
Did you know that the earliest forms of technical analysis can be traced back to 17th-century Japan? Rice traders developed candlestick charts to track the price movements of rice, providing a visual representation of supply and demand. These early charts laid the foundation for the modern candlestick charts that are widely used today. Another fun fact is that the Fibonacci sequence, a series of numbers where each number is the sum of the two preceding ones (e.g., 1, 1, 2, 3, 5, 8), appears frequently in technical analysis. Fibonacci retracement levels and extensions are used to identify potential levels of support and resistance based on this sequence. Many traders swear by these levels, believing that they hold special significance in the market. Another interesting aspect of technical analysis is the use of Elliott Wave Theory, which posits that market prices move in predictable patterns called waves.These waves are based on crowd psychology and are said to reflect the collective emotions of traders. While Elliott Wave Theory can be complex and subjective, it provides a fascinating perspective on market dynamics. Technical analysis is not an exact science, and there is always an element of uncertainty involved. However, by understanding the principles and techniques of technical analysis, you can increase your chances of success in the market and make more informed trading decisions. It's a never-ending journey of learning and refinement, but the rewards can be well worth the effort.
How to Backtest Your Trading Strategies
Backtesting is the process of testing your trading strategies on historical data to see how they would have performed in the past. It's an essential step in developing a profitable trading system and can help you identify potential weaknesses in your strategies before you risk real money. The first step in backtesting is to choose a charting platform that offers historical data and backtesting capabilities. Trading View is a popular option that allows you to backtest your strategies using Pine Script, a programming language specifically designed for trading analysis. Once you've chosen a platform, you need to define your trading rules clearly and precisely. This includes specifying your entry and exit criteria, as well as your risk management rules. For example, you might specify that you will buy when the price crosses above the 50-day moving average and sell when the price crosses below the 200-day moving average, with a stop-loss order placed 5% below the entry price. After defining your rules, you can run your backtest and analyze the results. Look for metrics such as the win rate, profit factor, and maximum drawdown. The win rate is the percentage of trades that were profitable, while the profit factor is the ratio of gross profit to gross loss. The maximum drawdown is the largest peak-to-trough decline in your portfolio value during the backtesting period. By analyzing these metrics, you can get a good sense of the overall performance of your trading strategy. It's important to remember that backtesting is not a guarantee of future success. Market conditions can change over time, and a strategy that performed well in the past may not perform as well in the future. However, backtesting can provide valuable insights into the potential viability of your trading strategies and help you identify areas for improvement. Reading crypto charts can be easier when you understand how your strategies will work.
What if Technical Analysis Fails?
Even the most skilled technical analysts can experience failures. Market conditions can change rapidly, unexpected news events can trigger sudden price movements, and even the best trading strategies can encounter losing streaks. It's important to be prepared for these situations and have a plan in place to manage your risks. One of the most important things to remember is that technical analysis is not a crystal ball. It's a tool for identifying probabilities and making informed trading decisions, but it's not a guarantee of success. There will be times when your analysis is wrong, and the market moves against you. In these situations, it's crucial to have a stop-loss order in place to limit your potential losses. Another important consideration is to diversify your portfolio. Don't put all your eggs in one basket, and spread your investments across different cryptocurrencies and asset classes. This can help to mitigate your overall risk and reduce the impact of any single losing trade. It's also important to be flexible and adaptable. The market is constantly evolving, and what worked yesterday may not work today. Be willing to adjust your trading strategies as needed and stay up-to-date with the latest trends and techniques. Finally, don't let your emotions cloud your judgment. Fear and greed can lead to irrational decisions, and it's important to stay calm and disciplined, even in the face of adversity. If technical analysis fails, don't panic. Learn from your mistakes, adjust your strategies, and keep moving forward. With patience, discipline, and a willingness to learn, you can overcome challenges and achieve long-term success in the crypto market. This approach is important for reading crypto charts and staying positive.
Top 5 Technical Analysis Tools for Beginners
1.Moving Averages: Simple and effective for identifying trends. Use the 50-day and 200-day moving averages to gauge the overall direction of the market.
2.Relative Strength Index (RSI): Helps identify overbought and oversold conditions. Look for readings above 70 (overbought) or below 30 (oversold).
3.Support and Resistance Levels: Identify key price levels where the market is likely to find support or resistance. These levels can be used to set entry and exit points.
4.Candlestick Patterns: Learn to recognize common candlestick patterns, such as bullish engulfing, bearish engulfing, and doji. These patterns can provide valuable insights into market sentiment.
5.Volume Analysis: Use volume to confirm price movements and identify potential breakouts. Look for high volume on breakouts to increase the likelihood of success.
Question and Answer Section
Q: What is the most important thing to learn when starting with technical analysis?
A: Understanding candlestick patterns is crucial. They provide a visual representation of price action and can help you identify potential trading opportunities.
Q: How many technical indicators should I use at once?
A: It's best to start with a few key indicators and master them before adding more. Overloading your charts with too many indicators can lead to confusion and analysis paralysis.
Q: Can technical analysis guarantee profits?
A: No, technical analysis is not a crystal ball. It's a tool for identifying probabilities, but there are no guarantees in trading. Always manage your risks and use stop-loss orders.
Q: What is the best way to practice technical analysis?
A: The best way to practice is by studying charts, applying technical indicators, and backtesting your trading strategies. Practice is the key to developing your skills and building your confidence.
Conclusion of How to Read Crypto Charts: Technical Analysis Guide for Beginners (2025)
Mastering technical analysis for crypto charts is a journey, not a destination. It requires dedication, practice, and a willingness to learn. By understanding the basics of candlestick charts, technical indicators, and chart patterns, you can gain a significant edge in the market and make more informed trading decisions. Remember to manage your risks, stay disciplined, and never stop learning. The world of crypto is constantly evolving, and the more knowledge you have, the better equipped you'll be to navigate its complexities and achieve your trading goals.
Post a Comment